
An install count tells you how much acquisition activity a campaign produced. It does not tell you whether the people acquired found lasting value, generated useful revenue or would have arrived without the ad. Installs become a vanity metric when the reporting stops there.
For an app business evaluating paid-social growth, D7 and D30 can be useful decision checkpoints. They are not universal grades. The aim is to compare users at the same age, understand what the metrics actually count, and connect those observations to an economic decision the business can defend.
Define the cohort before judging it
A cohort is a group with a shared starting condition. For acquisition reporting, that might be first-time users attributed to a campaign during a defined week. Write down the entry event, acquisition dates, timezone, platform, market and attribution scope. Keep new-user acquisition separate from re-engagement unless a combined view is deliberately required.
Then define what a return means. Opening the app can measure broad activity; completing a useful task can answer a different product question. A utilities app used when a specific need arises may deserve a different review window from a daily-use rewards app. A fintech app's deposit is not automatically revenue. The app business should identify the behavior that represents value; a media partner should not invent it from whatever event is easiest to count.
Use a short measurement contract: “First-time attributed users, acquired in this date range, with this qualifying return event, measured in this time window.” Record changes to that contract. Otherwise a new event mapping can look like an improvement in customer quality.
D7 is not one universal calculation
“Returned on day 7,” “returned by day 7” and “returned on day 7 or later” answer different questions. Amplitude explicitly distinguishes Return On from Return On or After. Its documentation also distinguishes rolling 24-hour windows from strict calendar dates. A rolling time window is not the same thing as an unbounded retention definition. [2][3]
Choose one definition for the comparison and label it in the report. With exact-day retention, a user who returns on day 6 but not day 7 is not a D7 returner. That does not necessarily mean the user has permanently left. Nor must every exact-day curve fall smoothly: product usage patterns can produce later peaks.
Show the numerator and denominator beside the percentage. “120 qualifying returners out of 1,000 eligible users” is easier to inspect than “12% retention” alone. This is a definition example, not a performance benchmark. If tools disagree, first compare their starting event, return event, timezone, day boundaries and eligible population before changing a campaign.
Compare completed periods, not old users with new users
A cohort acquired recently has not had the same opportunity to reach D30 as one acquired a month earlier. Missing future periods are not zeros. AppsFlyer distinguishes complete from partial cohort data and on-day from cumulative measures; its cohort periods are calendar-based. [1]
For a D30 comparison, include only cohorts whose full D30 observation period has elapsed under the chosen definition, then allow for the relevant reporting lag. Compare D7 with D7 and D30 with D30. Mark immature cells as pending, not poor performance.
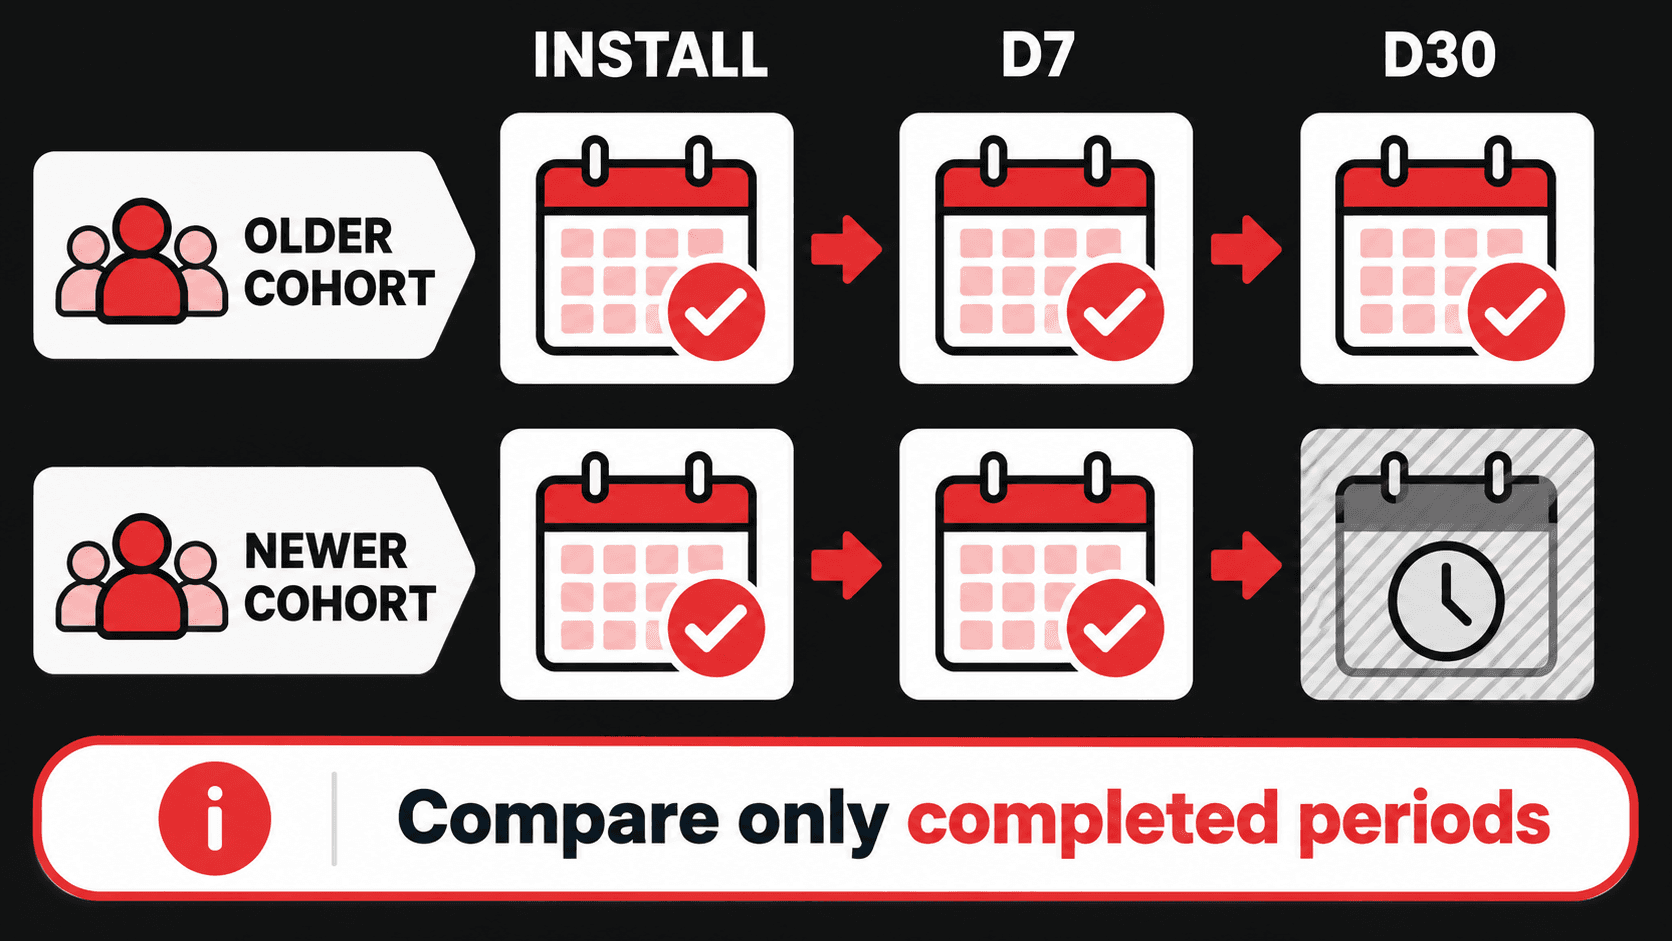
Do not let a blended total hide a change in acquisition mix. A newer campaign may contain more users from a different market, operating system or creative promise. Start with a broad like-for-like comparison, then investigate the dimensions most likely to explain a difference. Splitting every result into tiny segments creates fragile conclusions instead of useful precision.
There is no universal minimum cohort size or waiting period that makes every decision safe. The amount of evidence needed depends on outcome frequency, variability and the cost of being wrong. Look at counts, consistency across comparable cohorts and uncertainty, rather than treating one small percentage movement as a verdict.
Read retention and revenue together
Retention shows repeat behavior, not profitability. A campaign can attract frequent users who generate little value, or fewer returning users whose activity supports the business. Review a small set of measures together: eligible acquired users, activation, D7 and D30 returners, payer or qualifying-customer counts, and cumulative revenue through the same cohort age.
A practical comparison uses three clearly named calculations: cost per qualifying retained user, cumulative revenue per acquired user, and cohort revenue divided by the corresponding acquisition spend. Keep the underlying counts and money visible so that a ratio cannot conceal a very small sample or a missing cost category.
Ask what “revenue” means in the actual integration. Is the report using gross purchase value, net revenue, advertising revenue or another field? How are refunds, taxes, platform fees and currency handled? AppsFlyer supports negative revenue for refunds and cancellations, and now documents a separate net-revenue parameter; some store-revenue integrations can calculate net revenue after fees and taxes. Do not assume that every report is gross, net or accounting profit without checking its configuration. [4]
For a rewards app, a rewarded action is not automatically margin. For a subscription utility, an initial payment is not the same as retained subscription revenue. Product economics belong in the interpretation, even when the campaign report itself cannot contain the complete cost model.
Reconcile the spend and the measurement gaps
A cohort report is not necessarily a complete spending ledger. AppsFlyer notes that cohort cost includes cost associated with attribution; spending with no associated attribution can be absent. Reconcile media invoices and any separately billed acquisition services before treating cohort ROAS as overall acquisition efficiency. Avoid both omitting a cost and counting it twice. [1]
Keep three views distinct: the platform's campaign report, the measurement system's attributed cohort, and the app business's financial outcome. Explain differences rather than forcing totals to match. Late events, refunds, attribution settings and reporting coverage can all change what each view contains.
Privacy-preserving iOS reporting introduces another limit. Apple describes crowd-anonymity thresholds that affect available conversion detail and postback fields. Missing campaign-level detail is not proof that nobody returned or generated revenue. Show coverage and unknowns separately, and do not present aggregate attribution postbacks as a complete user-level D7/D30 history. [5]
A growth partner should be able to explain which conclusions are supported, which rely on modeled or incomplete reporting, and which require information from the app team. Uncertainty is part of the result, not a footnote to remove from a presentation.
Turn the review into a bounded decision
Before launch, agree what the business needs to learn at each checkpoint. D7 may help detect weak activation or a mismatch between the creative promise and the app experience. D30 may offer a more useful view of repeat behavior and early revenue, but it is not lifetime value. Whether either checkpoint is sufficient depends on the product's normal usage and monetization cycle.
Use the review to choose an action with a reason:
- Continue cautiously when comparable mature cohorts support the agreed economics and the measurement is dependable. A stronger result at the current spend does not guarantee the same result at a larger spend.
- Investigate when activation, retention or revenue diverges. Check changes in creative, audience mix, onboarding and event instrumentation before assigning the problem to media quality alone.
- Limit further exposure when the data cannot distinguish a poor outcome from a reporting failure. Set the next evidence needed and who owns it instead of waiting indefinitely or scaling through uncertainty.
Finally, keep observed quality separate from causal lift. A retained, revenue-generating attributed user is valuable evidence, but attribution does not prove that advertising caused every outcome. A suitable incrementality experiment addresses that separate question. AppsFlyer explicitly distinguishes granular attribution from experimental measurement of incremental impact. [6]
The useful question is not “How many installs did we buy?” It is “What did comparable, mature cohorts do next, what did that cost, and what is the evidence strong enough to change?” A credible performance marketing partner makes that decision clearer without pretending to control the app or promising a universal retention target.
Sources
Sources checked October 26, 2026. Recommendations are editorial synthesis, not universal benchmarks or private client results.
[1] AppsFlyer: Cohort and retention dashboard.
[2] Amplitude: Retention calculation.
[3] Amplitude: How time works in retention analysis.